Mapping Activation Space: Peeking Inside the Model

The previous post covered what happens when you hit enter. Tokens flow through layers, probabilities get shaped, text comes out. System prompts anchor the model in activation space. Temperature controls how tightly it follows that anchor.

This post goes one level deeper, into the model’s layers. What are those activations? What shape do they take?

For this experiment, I used a well-documented workflow built around Google’s Gemma 2 2B model and the Gemma Scope residual stream SAEs. These are Sparse Autoencoders trained by Google on Gemma’s residual stream activations. They act as auxiliary models that decompose dense internal states into sparse, more interpretable features. The tools are Gemma-specific but the concepts apply to any transformer model.


Vectors: The Model’s Internal Language

Think about the gas laws. Compress a gas, it gets hotter. The macroscopic behavior is simple. Underneath, there’s a seething mass of atoms bouncing around, and the real explanation to why it gets hot when compressed lives in those microscopic dynamics.

Neural networks work the same way.

  • The macroscopic behavior is “the model talks about France.”
  • The microscopic dynamics are activation patterns flowing through 2304-dimensional space.

We’re mapping the microscopic level

A vector is a list of numbers. In Gemma 2 2B, the vector at each token position is a list of 2304 numbers. That’s the model’s d_model dimension, its internal working width.

No single number in that list is human-readable. But the pattern across all 2304 numbers encodes what the model “knows” at that point in the text.

When Gemma processes “The capital of France is”, it does not have a dedicated slot for “France” and another slot for “capital”. Instead, the model has a specific geometric direction for “France” and another direction for “capital”. It adds those vectors together.

The vector at the last token position is just the mathematical sum of all those active concepts.

Because it was built through vector addition, that single coordinate in 2304-dimensional space contains the combined geometry of “France”, “geography”, and “Paris is next”.

We cannot visualize that space directly, but the model moves through it constantly, and every prediction depends on exactly where that final coordinate lands.

Toy Models of Superposition

The Linear Representation Hypothesis and the Geometry of Large Language Models


The Residual Stream: The Highway Everything Rides On

Vectors are the payload; the Residual stream is the bus. It is the main data pipeline through the transformer.

That 2304-dimensional vector persists across all 26 layers. Each layer does not replace it outright. It reads the current residual stream, computes an update, and adds that update back in.

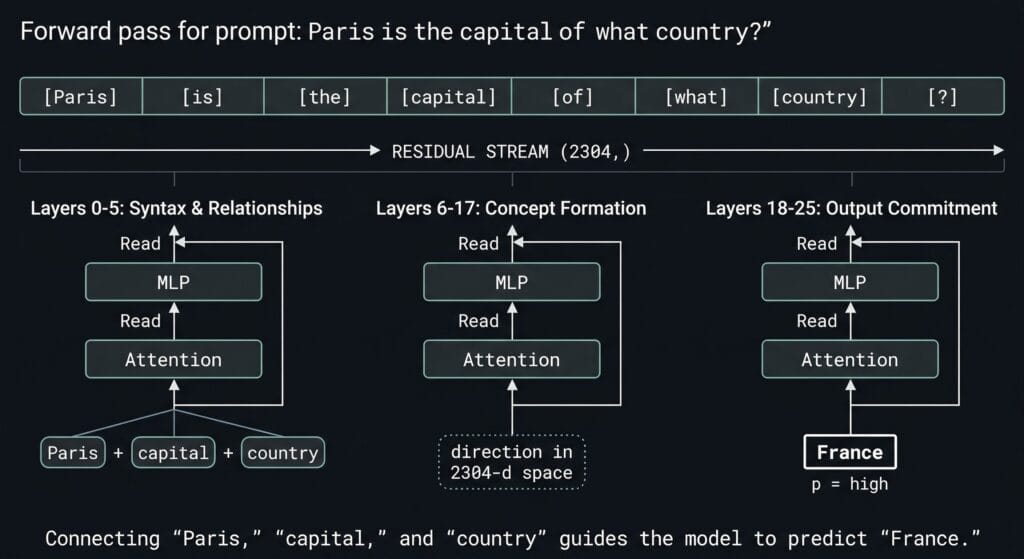
The token embedding creates the initial vector. Layer 0 attention reads it, computes an update, adds it back. Layer 0 MLP does the same. This continues through all 26 layers, and the final vector gets mapped to token probabilities.
That additive pattern is why the residual stream is such an important place to inspect. Earlier information can remain available while later layers keep reshaping it. What survives, what gets amplified, and what becomes less useful depends on the sequence of updates across the network.

  • A prompt goes in. The model processes it token by token.
  • At layer 12, each token has a vector of shape (2304,) in the residual stream.
  • The SAE encoder maps that dense vector into a sparse feature space (16,384 dimensions for the coarse SAE, 262,144 for the fine SAE) where only a small number of features activate.
  • The SAE decoder maps the sparse representation back into (2304,) to approximate the original residual state.
  • A steering vector is the decoder vector for a specific SAE feature. Adding it into the residual stream biases the model toward that feature’s pattern. Phase 2 will test this.

Why Layer 12?

Gemma 2 2B has 26 transformer layers, numbered 0 through 25. I’m hooking into layer 12 โ€” roughly 46% depth.

The hook point is blocks.12.hook_resid_post, capturing the residual stream after layer 12 finishes processing.

Production inference engines and local runners use quantized formats and custom C++ engines for speed, which strips out the Python-level hook system.

To get around this, we load the exact same Gemma 2 2B weights from HuggingFace as native PyTorch tensors (raw weights), which gives us the ability to tap any layer.

Gemma Scope trained SAEs on every layer of Gemma 2 2B, so layer 12 was a deliberate choice was based on Google’s own interpretability research papers.

Announcing Gemma Scope 2 โ€” AI Alignment Forum

Gemma_Scope_2_Technical_Paper.pdf


What Does “Mapping Activations” Mean?

  • Coarse (16K SAE): fewer features, each covering more conceptual ground.
  • Fine (262K SAE): more features, each with higher resolution on specific facets.

An SAE decomposes a single 2304-number vector into thousands of sparse components called features.

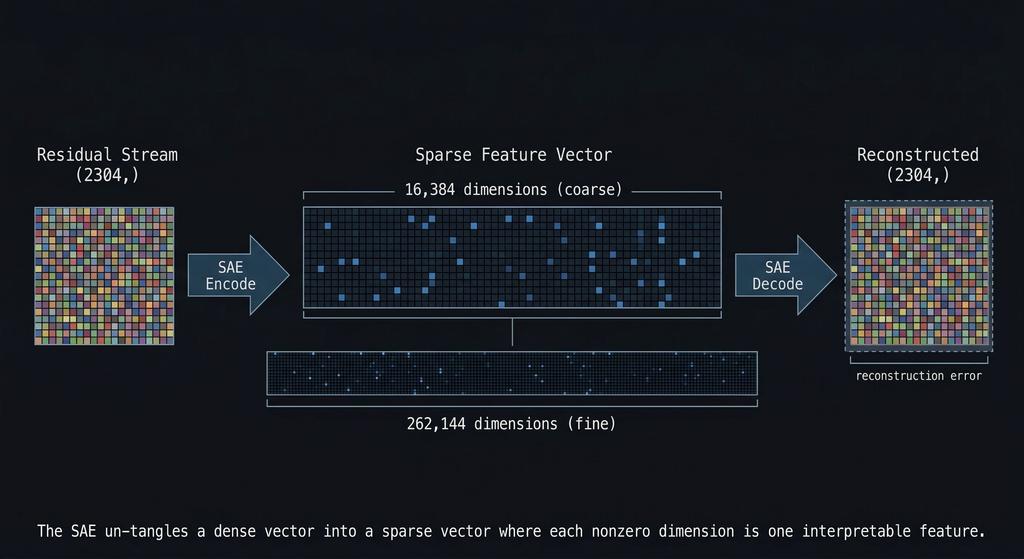
The residual stream is dense and compressed. Gemma has to represent a huge amount of structure in just 2304 dimensions, so many different patterns get packed together in superposition. That means individual residual dimensions are not clean, human-readable concept slots. A single dimension can participate in multiple unrelated behaviors depending on the context.

This is where the Sparse Autoencoder helps. Instead of trying to interpret the raw 2304-dimensional state directly, the SAE projects it into a much larger sparse feature space, such as 16K or 262K features. In that expanded space, only a small number of features activate for a given input, and those features are often easier to interpret than the original dense residual dimensions.

So back to the actual numbers. The SAE takes that tightly packed, dense circuitry and expands it out into a much wider space so we can see which patterns actually fired.

How sparse is sparse, what is a SAE?

Think of an audio spectrum analyzer. It takes a single, dense audio wave where the kick drum, bass, and vocals are all mashed together, and splits them out into distinct frequency bands. Most bands stay flat. Only the frequencies actually present in the audio spike up.

The SAE is a semantic spectrum analyzer.

The model’s Layer 12 vector is the dense audio wave, a 2304-number mess where all the active concepts are added together.

The SAE takes that dense wave and splits it out across 16,384 distinct “frequency bands” (features).

Because a single sentence only contains a handful of concepts, the SAE only spikes about 82 of those bands to represent the entire input.

The other 16,000+ bands stay flat at zero simply because those concepts are not in the sentence. Out of 16,384 possible patterns the SAE can detect, a typical input lights up fewer than 1% of them. The rest stay silent. That is what sparse means.

Feature #3999:   mean activation 3.67, selectivity 0.97  โ† France (strongest signal)
Feature #11333:  mean activation 4.48, selectivity 0.89  โ† France-related
Feature #9473:   mean activation 1.21, selectivity 0.88  โ† France-related
Feature #14805:  mean activation 1.24, selectivity 0.86  โ† France-related
Feature #6211:   mean activation 1.27, selectivity 0.86  โ† France-related
...
Feature #6,004:  activation 0.00                         โ† silent
Feature #6,005:  activation 0.00                         โ† silent
[~11,000 more at zero]


The key column we should focus on is selectivity: how exclusively does a feature fire on France prompts versus neutral ones?

Feature #3999 scores 0.97. This means it almost exclusively fires on France-related input. Notice #11333 actually fires harder (mean 4.48 vs 3.67) but has lower selectivity. It bleeds into neutral prompts too. A feature that fires on everything is not telling you anything useful, no matter how loud it is.

I chose France as a sanity-check target because the interpretability method was already grounded in prior work, and Gemma Scope gave me a validated SAE setup to test whether my own pipeline outputted correct Data.

The experiment follows standard A/B logic.

  • Run 400 prompts total through Gemma: 200 France-themed prompts and 200 neutral filler prompts.
  • Capture the layer 12 activations for both sets.
  • Decompose both through the same SAEs.
  • Use Python to compare features that fire consistently on the France set but stay quiet on the neutral sets.

Now we have the candidates for “France features.” Features that fire on everything else can be safely considered noise.

Two Resolutions, One Concept

The 16K SAE (coarse) might give you one feature, call it #3999, that broadly responds to “France.” One fat bucket for the whole concept.

The 262K SAE (fine) might split that same concept into multiple features.

Feature #86473 fires on a subset of France prompts. Feature #249284 fires on a different subset. Feature #243533 on another.

Each one potentially encodes a different facet (cuisine, geography, landmarks, language), though we do not know which facets they are yet. More on that problem in a minute.

This is hierarchical feature decomposition.

Same logic as hand-designing a vision network:

  • Edges combine into shapes
  • Shapes combine into objects
  • Objects together in a scene change the meaning again (meaning as in what regions get excited to infer what it is)

but instead of happening across multiple sequential layers, this hierarchy exists at different levels of granularity within the exact same layer.

The coarse SAE has a smaller dictionary, so it is forced to find the whole object.

The fine SAE has a massive dictionary, so it can afford to isolate the specific parts and edges. Nobody hand-wired these decompositions. They emerged naturally from the training data.

The cross-resolution mapping step figures out which fine features correspond to which coarse features. It measures two things:

  • Activation correlation: Do they fire on the same prompts? (behavioral evidence)
  • Decoder cosine similarity: Do their decoder vectors point in the same direction in the 2304-dimensional residual stream? (Geometric evidence)

Here are the actual results from the experiment.

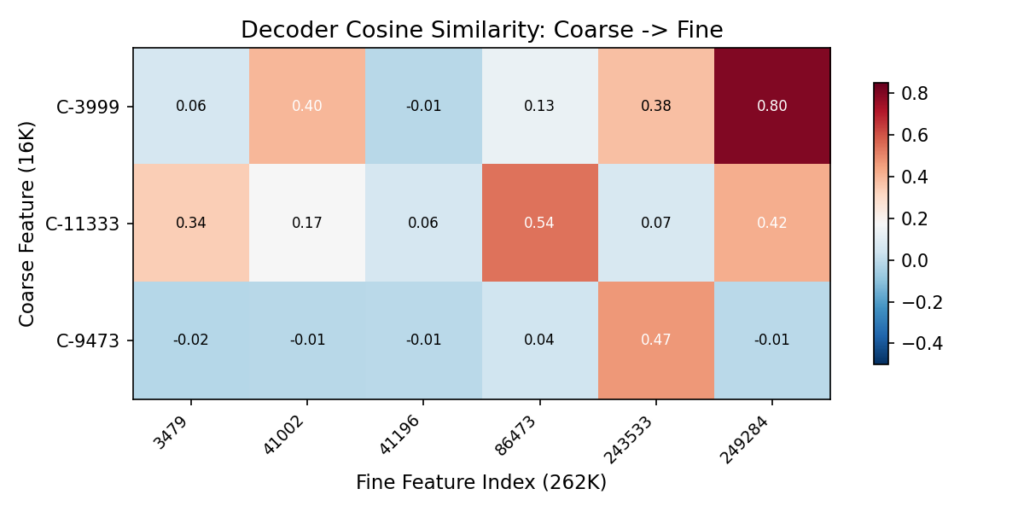
The Heatmap: Decoder Cosine Similarity

The heatmap shows the same data from a different angle. Each cell measures how much a coarse features and a fine features point in the same direction inside the model.

  • High values mean they’re encoding the same thing at different zoom levels.
  • Low values mean they’re unrelated.
CoarseStrongest Fine MatchSimilarityReading
C-3999F-2492840.80Near-identical direction. Almost certainly the same concept at different granularity
C-11333F-864730.54Strong overlap, plus two more matches at 0.42 and 0.34
C-9473F-2435330.47One clear sub-feature

Values near zero mean unrelated. Above 0.3 is meaningful geometric correspondence.

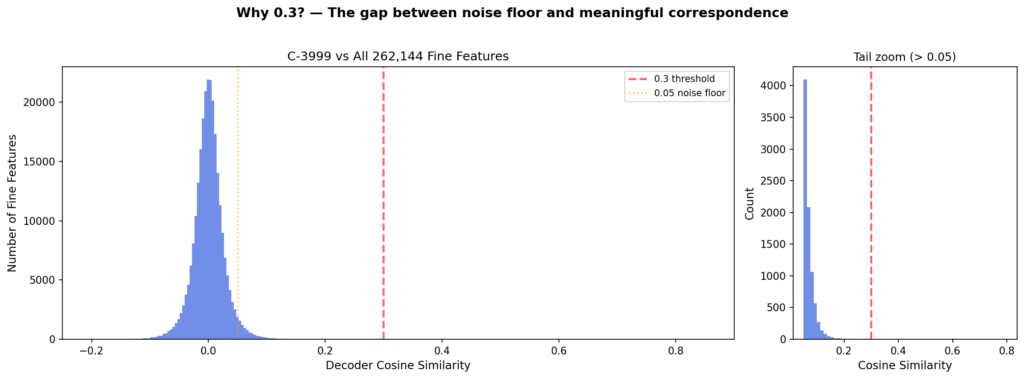
Each of the 262,000 fine features was compared against C-3999 to see how closely they point in the same direction. Almost all of them scored near zero, meaning no geometric alignment.
The histogram shows where the crowd is: piled up at zero, with a long empty stretch before the red line at 0.3. The handful of features past that line are the ones that actually share a direction with C-3999. That’s why 0.3 is the cutoff. It’s where the crowd ends and the signal begins.

Coarse-to-Fine Feature Decomposition

Every prompt was decoded through both SAEs at the same time. The coarse SAE gave us three broad France features. The fine SAE gave us six narrow ones.

The interactive dashboard below maps every possible pair of these coarse and fine features to measure how strong their relationship actually is.

All data shown is derived from real activations collected by running 400 prompts through Gemma 2 2B and decomposing layer 12 through both Gemma Scope SAEs.

The left side shows the decomposition graph. It maps exactly which fine features branch off from our three coarse anchors.

  • Link width represents behavioral correlation (do they fire together?).
  • Link color represents geometric similarity (do they point the same way?).

The right side plots these exact same pairs in metric space:

  • The X-axis is behavioral correlation: do they fire on the exact same prompts?
  • The Y-axis is geometric similarity: do their vectors point in the same direction inside the model?

Look at the color coding on the scatter plot. It tells the whole story:

Blue dots (Top Right): These are the true sub-feature matches. They have high correlation and high geometric similarity.

They co-fire AND point the same way inside the model. The strongest pair is C-3999 to F-249284.

Orange dots (Middle): These are partial overlaps.

They fire together often, but their geometry is drifting apart.

Red dots (Bottom): These are co-occurring concepts. They sit in the lower half with moderate correlation but cosine similarity near zero. These features fire on many of the same prompts but point in completely different directions.

They co-occur with France, but they are not encoding the same concept. They are related ideas that travel together, not the same idea at two zoom levels.

Reading the scatter plot

To better understand the graph, think of these features as passive sensors hooked up to the Layer 12 data bus:

1. The Empty Top-Left (High Similarity, Low Correlation)
If Sensor A and Sensor B point in the exact same direction, they are going to catch the exact same meandering vectors. Always. You physically cannot have a vector pass by that trips Sensor A but misses Sensor B. That is why high geometric similarity mathematically forces high correlation. The top-left is empty because it defies physics.

2. The Bottom-Right (Low Similarity, High Correlation)
Sensor A points at “France”. Sensor B points at “Food”. They point in completely different directions (low geometric similarity). But when the vector for “French Cuisine” meanders down the data bus, it contains enough geometry to trip both sensors at the same time. They fire together (high correlation) even though they are looking for different things. These are your co-occurring concepts.

3. Low Selectivity (The noisy features)
If a sensor points in a direction that catches “France” but also catches a bunch of other random vectors meandering by (like “Germany” or “cheese”), it will have a lower selectivity score. This is exactly what you saw with Feature #11333 earlier in the postโ€”it fired loud, but it fired on too much unrelated traffic to be a clean “France” feature.


The Interpretation Gap

C-3999 gets labeled “France” because it reliably activates on France prompts and not on neutral ones. That’s standard practice in interpretability work. Label a feature by what activates it.

But the model doesn’t know the word “France.” It has a direction in 2304-dimensional space that, for whatever internal reason, turned out to be useful for predicting the next token when France-related patterns show up. We call it “France” because that’s the human category our test prompts were organized around. The model’s internal geometry might carve the world along boundaries that don’t align with our conceptual categories at all โ€” we just can’t tell, because we only test with prompts organized around our categories.

What we actually knowWhat we’re assuming
C-3999 fires on France prompts, not neutralC-3999 “means” France
F-86473 fires on a subset of France promptsF-86473 is a France sub-concept
C-3999 and F-249284 point in similar directionsThey encode related meanings
Injecting C-3999’s direction changes output toward France-like textThe feature is causally involved in France generation

The labels (“French cuisine,” “Paris landmarks”) are human interpretations based on which prompts activate a feature. The model doesn’t have those labels. It has frozen weights and an activation landscape that we’re projecting human categories onto.

Neural nets don’t memorize data. They find regularities and generalize those regularities to new data. A model will generate plausible text about unicorns even though it’s never seen one described as real, because it’s learned the relational structure of mythical creatures, horses, and horns. The internal representation that enables that generalization doesn’t need to map onto our concept of “unicorn.” It just needs to be useful for next-token prediction. When we label a feature “France,” we’re assuming the model’s useful regularity aligns with our semantic boundary. Sometimes it does. Sometimes we don’t know.

This is the wall that people like Neel Nanda keep writing about in mechanistic interpretability research. It was interesting to actually hit it myself. I can identify which features fire and when.

We can measure geometric relationships between them. But mapping that to human-readable meaning is always an inference, never ground truth.

When I started this project, I wanted to build something like the Activation Space Navigator from the previous post, but using real model data derived from SAEs, I pictured clean clusters with labeled regions where you could point and say, โ€œthatโ€™s France.โ€

The real data did not look like that. What it gave me instead were directions in the modelโ€™s internal representation that reliably correlate with France-themed input.


Every feature in the SAE is a literal 2304-dimensional vector stored in the SAE’s decoder matrix. Feature C-3999 is just row #3999 in that matrix. It acts as a static reference coordinate for “France”.

This exact mechanic applies to any concept. If we were testing Python code, HTML tables, or HTTP status codes, there would be a different row acting as the reference coordinate for that specific pattern.

The reference vectors in the SAE do not move. They are fixed in place like highway signs. The model’s dynamic state passes by them.

When the France prompt generates a vector that passes close to the C-3999 sign, that specific band on our semantic spectrum analyzer spikes.

Neutral prompts pass further away, so the band stays flat. Those spikes are the sparse values we actually record.

One thing worth naming: this is all an approximation. The SAE reconstructs the residual stream from its learned directions, and the reconstruction is not perfect. Some signal is always lost. We are working with a useful approximation of the model’s internal state, not the thing itself.

So it is not that “France activated these regions of the model’s weights.” The weights are frozen. The model has learned internal directions for France-related patterns, and when France text flows through, the residual stream aligns with those directions. That alignment is what we are measuring.


Closing the loop

The previous post described system prompts as activation-space manipulation. This experiment gives me supporting evidence for that framing.

The directions those prompts appear to push activations toward are measurable, and some of that structure can be decomposed into narrower features.

What I found is suggestive structure, not full semantic ground truth.

The coarse-to-fine matches look real enough to justify the next step, which is testing whether steering along those directions’ changes generation in a targeted way.

What’s Next for This Project

The activation mapping is done. I found and observed suggestive structure:

coarse France-related features that appear to decompose into finer sub-features, supported by both behavioral correlation and geometric similarity.

The GO/NO-GO question was whether the coarse-to-fine mapping would produce 3+ meaningful sub-features per coarse anchor.

C-11333 has three above threshold. That’s a GO.

Phase 2 is the actual Steering Experiment.

Take those mapped features and test whether multi-resolution steering (coarse “France” + fine sub-features) produces better, more targeted output than single-resolution steering alone.

If it does, that’s evidence the cross-resolution structure isn’t just a statistical artifact. It’s a lever we can pull to tweak the behavior of a model

If it doesn’t, the structure is real but doesn’t actually control what the model generates. Correlation isn’t causation, even inside a neural network.

Either way, I’ll know more about what those frozen weights are actually doing when we hit enter.


References


Kubernetes Loop

I’ve been diving deep into systems architecture lately, specifically Kubernetes

Strip away the UIs, the YAML, and the ceremony, and Kubernetes boils down to:

A very stubborn event driven collection of control loops

aka the reconciliation (Control) loop, and everything I read is calling this the โ€œgold standardโ€ for distributed control planes.

Because it decomposes the control plane into many small, independent loops, each continuously correcting drift rather than trying to execute perfect one-shot workflows. these loops are triggered by events or state changes, but what they do is determined by the the spec. vs observed state (status)

Now we have both:

  • spec: desired state
  • status: observed state

Kubernetes lives in that gap.

When spec and status match, everything’s quiet. When they don’t, something wakes up to ensure current state matches the declared state.

The Architecture of Trust

In Kubernetes, they donโ€™t coordinate via direct peer-to-peer orchestration; They coordinate by writing to and watching one shared “state.”

That state lives behind the API server, and the API server validates it and persists it into etcd.

Role of the API server

The API server is the front door to the clusterโ€™s shared truth: itโ€™s the only place that can accept, validate, and persist declared intent as Kubernetes API objects (metadata/spec/status).

When you install a CRD, youโ€™re extending the API itself with a new type (a new endpoint) or a schema the API server can validate against

When we use kubectl apply (or any client) to submit YAML/JSON to the API server, the API server validates it (built-in rules, CRD OpenAPI v3 schema / CEL rules, and potentially admission webhooks) and rejects invalid objects before theyโ€™re stored.

If the request passes validation, the API server persists the object into etcd (the whole API object, not just โ€œintentโ€), and controllers/operators then watch that stored state and do the reconciliation work to make reality match it.

Once stored, controllers/operators (loops) watch those objects and run reconciliation to push the real world toward whatโ€™s declared.

it turns out In practice, most controllers donโ€™t act directly on raw watch events, they consume changes through informer caches and queue work onto a rate-limited workqueue. They also often watch related/owned resources (secondary watches), not just the primary object, to stay convergent.

spec is often user-authored as discussed above, but it isnโ€™t exclusively human-written, the scheduler and some controllers also update parts of it (e.g., scheduling decisions/bindings and defaulting).

Role of etcd cluster

etcd is the control planeโ€™s durable record of โ€œthe authoritative reference for what the cluster believes that should exist and what it currently reports.”

If an intent (an API object) isnโ€™t in etcd, controllers canโ€™t converge on itโ€”because thereโ€™s nothing recorded to reconcile toward

This makes the system inherently self-healing because it trusts the declared state and keeps trying to morph the world to match until those two align.

One tidbit worth noting:

In production, Nodes, runtimes, cloud load balancers can drift independently. Controllers treat those systems as observed state, and they keep measuring reality against what the API says should exist.

How the Loop Actually Works

 Kubernetes isn’t one loop. It’s a bunch of loops(controllers) that all behave the same way:

  • read desired state (what the API says should exist)
  • observe actual state (what’s really happening)
  • calculate the diff
  • push reality toward the spec


As an example, let’s look at a simple nginx workload deployment

1) Intent (Desired State)

To Deploy the Nginx workload. You run:

kubectl apply -f nginx.yaml


The API server validates the object (and its schema, if it’s a CRD-backed type) and writes it into etcd.

At that point, Kubernetes has only recorded your intent. Nothing has “deployed” yet in the physical sense. The cluster has simply accepted:

“This is what the world should look like.”

2) Watch (The Trigger)

Controllers and schedulers aren’t polling the cluster like a bash script with a sleep 10.

They watch the API server.

When desired state changes, the loop responsible for it wakes up, runs through its logic, and acts:

“New desired state: someone wants an Nginx Pod.”

watches aren’t gospel. Events can arrive twice, late, or never, and your controller still has to converge. Controllers use list+watch patterns with periodic resync as a safety net. The point isn’t perfect signals it’s building a loop that stays correct under imperfect signals.

Controllers also don’t spin constantly they queue work. Events enqueue object keys; workers dequeue and reconcile; failures requeue with backoff. This keeps one bad object from melting the control plane.

3) Reconcile (Close the Gap)

Here’s the mental map that made sense to me:

Kubernetes is a set of level-triggered control loops. You declare desired state in the API, and independent loops keep working until the real world matches what you asked for.

  • Controllers (Deployment/ReplicaSet/etc.) watch the API for desired state and write more desired state.
    • Example: a Deployment creates/updates a ReplicaSet; a ReplicaSet creates/updates Pods.
  • The scheduler finds Pods with no node assigned and picks a node.
    • It considers resource requests, node capacity, taints/tolerations, node selectors, (anti)affinity, topology spread, and other constraints.
    • It records its decision by setting spec.nodeName on the Pod.
  • The kubelet on the chosen node notices โ€œa Pod is assigned to meโ€ and makes it real.
    • pulls images (if needed) via the container runtime (CRI)
    • sets up volumes/mounts (often via CSI)
    • triggers networking setup (CNI plugins do the actual wiring)
    • starts/monitors containers and reports status back to the API

Each component writes its state back into the API, and the next loop uses that as input. No single component โ€œruns the whole workflow.โ€

One property makes this survivable: reconcile must be safe to repeat (idempotent). The loop might run once or a hundred times (retries, resyncs, restarts, duplicate/missed watch events), and it should still converge to the same end result.

if the desired state is already satisfied, reconcile should do nothing; if something is missing, it should fill the gap, without creating duplicates or making things worse.

When concurrent updates happen (two controllers might try to update the same object at the same time)

Kubernetes handles this with optimistic concurrency. Every object has a resourceVersion (what version of this object did you read?โ€). If you try to write an update using an older version, the API server rejects it (often as a conflict).

Then the flow is: re-fetch the latest object, apply your change again, and retry.

4) Status (Report Back)

Once the pod is actually running, status flows back into the API.

The Loop Doesn’t Protect You From Yourself

What if the declared state says to delete something critical like kube-proxy or a CNI component? The loop doesn’t have opinions. It just does what the spec says.

A few things keep this from being a constant disaster:

  • Control plane components are special. The API server, etcd, scheduler, controller-manager these usually run as static pods managed directly by kubelet, not through the API. The reconciliation loop can’t easily delete the thing running the reconciliation loop as long as its manifest exists on disk.
  • DaemonSets recreate pods. Delete a kube-proxy pod and the DaemonSet controller sees “desired: 1, actual: 0” and spins up a new one. You’d have to delete the DaemonSet itself.
  • RBAC limits who can do what. Most users can’t touch kube-system resources.
  • Admission controllers can reject bad changes before they hit etcd.

But at the end, if your source of truth says “delete this,” the system will try. The model assumes your declared state is correct. Garbage in, garbage out.

This Pattern Outside Kubernetes

This pattern can be useful anywhere you manage state over time.

Scripts are fine until they aren’t:

  • they assume the world didn’t change since last run
  • they fail halfway and leave junk behind
  • they encode “steps” instead of “truth”

A loop is simpler:

  • define the desired state
  • store it somewhere authoritative
  • continuously reconcile reality back to it

Ref

Kafka 3.8 with Zookeeper SASL_SCRAM

ย 

Transport Encryption Methods:

SASL/SSL (Solid Teal/Green Lines):

  1. Used for securing communication between producers/consumers and Kafka brokers.
    • SASL (Simple Authentication and Security Layer): Authenticates clients (producers/consumers) to brokers, using SCRAM .
    • SSL/TLS (Secure Sockets Layer/Transport Layer Security): Encrypts the data in transit, ensuring confidentiality and integrity during transmission.

Digest-MD5 (Dashed Yellow Lines):

  1. Secures communication between Kafka brokers and the Zookeeper cluster.
    • Digest-MD5: A challenge-response authentication mechanism providing basic encryption

Notes:

While functional, Digest-MD5 is an older algorithm. we opted for this to reduce complexity and the fact the zookeepers have issues with connecting with Brokers via SSL/TLS

  1. We need to test and switch over KRAFT Protocol, this removes the use of Zookeeper altogether
  2. Add IP ACLs for Zookeeper connections using firewalld to limit traffic between the nodes for replication

PKI and Certificate Signing

CA cert for local PKI,

We need to share this PEM file(without the private key) with the customer to authenticate

Internal applications the CA file must be used for authentication – Refer to the Configuration example documents

# Generate CA Key
openssl genrsa -out multicastbits_CA.key 4096
# Generate CA Certificate
openssl req -x509 -new -nodes -key multicastbits_CA.key -sha256 -days 3650 -out multicastbits_CA.crt -subj "/CN=multicastbits_CA"


Kafka Broker Certificates

# For Node1 - Repeat for other nodes

openssl req -new -nodes -out node1.csr -newkey rsa:2048 -keyout node1.key -subj "/CN=kafka01.multicastbits.com"

openssl x509 -req -CA multicastbits_CA.crt -CAkey multicastbits_CA.key -CAcreateserial -in node1.csr -out node1.crt -days 3650 -sha256


Create the kafka and zookeeper users

โš ๏ธ Important: Do not skip this step. we need these users to setup Authentication in JaaS configuration

Before configuring the cluster with SSL and SASL, let’s start up the cluster without authentication and SSL to create the users. This allows us to:

  1. Verify basic dependencies and confirm the zookeeper and Kafka clusters are coming up without any issues “make sure the car starts”
  2. Create necessary user accounts for SCRAM
  3. Test for any inter-node communication issues (Blocked Ports 9092, 9093 ,2181 etc)


Here’s how to set up this initial configuration:

Zookeeper Configuration (No SSL or Auth)

Create the following file: /opt/kafka/kafka_2.13-3.8.0/config/zookeeper-NOSSL_AUTH.properties

# Zookeeper Configuration without Auth
dataDir=/Data_Disk/zookeeper/
clientPort=2181
initLimit=5
syncLimit=2
server.1=192.168.166.110:2888:3888
server.2=192.168.166.111:2888:3888
server.3=192.168.166.112:2888:3888


Kafka Broker Configuration (No SSL or Auth)

Create the following file: /opt/kafka/kafka_2.13-3.8.0/config/server-NOSSL_AUTH.properties

# Kafka Broker Configuration without Auth/SSL
broker.id=1
listeners=PLAINTEXT://kafka01.multicastbits.com:9092
advertised.listeners=PLAINTEXT://kafka01.multicastbits.com:9092
listener.security.protocol.map=PLAINTEXT:PLAINTEXT
zookeeper.connect=kafka01.multicastbits.com:2181,kafka02.multicastbits.com:2181,kafka03.multicastbits.com:2181


Open a new shell to the server Start Zookeeper:

/opt/kafka/kafka_2.13-3.8.0/bin/zookeeper-server-start.sh -daemon /opt/kafka/kafka_2.13-3.8.0/config/zookeeper-NOSSL_AUTH.properties


Open a new shell to start Kafka:

/opt/kafka/kafka_2.13-3.8.0/bin/kafka-server-start.sh -daemon /opt/kafka/kafka_2.13-3.8.0/config/server-NOSSL_AUTH.properties


Create the users:

Open a new shell and run the following commands:

kafka-configs.sh --bootstrap-server ext-kafka01.fleetcam.io:9092 --alter --add-config 'SCRAM-SHA-512=[password=zookeeper-password]' --entity-type users --entity-name ftszk

kafka-configs.sh --zookeeper ext-kafka01.fleetcam.io:2181 --alter --add-config 'SCRAM-SHA-512=[password=kafkaadmin-password]' --entity-type users --entity-name ftskafkaadminAfter the users are created without errors, press Ctrl+C to shut down the services we started earlier.


SASL_SSL configuration with SCRAM

Zookeeper configuration Notes

  • Zookeeper is configured with SASL/MD5 due to the SSL issues we faced during the initial setup
  • Zookeeper Traffic is isolated with in the Broker nodes to maintain security
dataDir=/Data_Disk/zookeeper/
clientPort=2181
initLimit=5
syncLimit=2
server.1=192.168.166.110:2888:3888
server.2=192.168.166.111:2888:3888
server.3=192.168.166.112:2888:3888
authProvider.1=org.apache.zookeeper.server.auth.SASLAuthenticationProvider
requireClientAuthScheme=sasl


/Data_Disk/zookeeper/myid file is updated corresponding to the zookeeper nodeID

cat /Data_Disk/zookeeper/myid
1


Jaas configuration

Create the Jaas configuration for zookeeper authentication, it has the follow this syntax

/opt/kafka/kafka_2.13-3.8.0/config/zookeeper-jaas.conf

Server {
   org.apache.zookeeper.server.auth.DigestLoginModule required
   user_multicastbitszk="zkpassword";
};


KafkaOPTS

KafkaOPTS Java varible need to be passed when the zookeeper is started to point to the correct JaaS file

export KAFKA_OPTS="-Djava.security.auth.login.config="Path to the zookeeper-jaas.conf"

export KAFKA_OPTS="-Djava.security.auth.login.config=/opt/kafka/kafka_2.13-3.8.0/config/zookeeper-jaas.conf"


There are few ways to handle this, you can add a script under profile.d or use a custom Zookeeper launch script for the systemd service

Systemd service

Create the launch shell script for Zookeeper

/opt/kafka/kafka_2.13-3.8.0/bin/zk-start.s

#!/bin/bash
#export the env variable
export KAFKA_OPTS="-Djava.security.auth.login.config=/opt/kafka/kafka_2.13-3.8.0/config/zookeeper-jaas.conf"
#Start the zookeeper service
/opt/kafka/kafka_2.13-3.8.0/bin/zookeeper-server-start.sh /opt/kafka/kafka_2.13-3.8.0/config/zookeeper.properties
#debug - launch config with no SSL - we need this for initial setup and debug
#/opt/kafka/kafka_2.13-3.8.0/bin/zookeeper-server-start.sh /opt/kafka/kafka_2.13-3.8.0/config/zookeeper-NOSSL_AUTH.properties


After you save the file

chomod +x /opt/kafka/kafka_2.13-3.8.0/bin/zk-start.s

sudo chown -R multicastbitskafka:multicastbitskafka /opt/kafka/kafka_2.13-3.8.0

Create the systemd service file

/etc/systemd/system/zookeeper.service

[Unit]
Description=Apache Zookeeper Service
After=network.target
[Service]
User=multicastbitskafka
Group=multicastbitskafka
ExecStart=/opt/kafka/kafka_2.13-3.8.0/bin/zk-start.sh
Restart=on-failure
[Install]


WantedBy=multi-user.target

After the file is saved, start the service

sudo systemctl daemon-reload.
sudo systemctl enable zookeeper
sudo systemctl start zookeeper


Kafka Broker configuration Notes

/opt/kafka/kafka_2.13-3.8.0/config/server.properties

broker.id=1
listeners=SASL_SSL://kafka01.multicastbits.com:9093
advertised.listeners=SASL_SSL://kafka01.multicastbits.com:9093
listener.security.protocol.map=SASL_SSL:SASL_SSL
authorizer.class.name=kafka.security.authorizer.AclAuthorizer
ssl.keystore.location=/opt/kafka/secrets/kafkanode1.keystore.jks
ssl.keystore.password=keystorePassword
ssl.truststore.location=/opt/kafka/secrets/kafkanode1.truststore.jks
ssl.truststore.password=truststorePassword
#SASL/SCRAM Authentication
sasl.enabled.mechanisms=SCRAM-SHA-256, SCRAM-SHA-512
sasl.mechanism.inter.broker.protocol=SCRAM-SHA-512
sasl.mechanism.client=SCRAM-SHA-512
security.inter.broker.protocol=SASL_SSL
#zookeeper
zookeeper.connect=kafka01.multicastbits.com:2181,kafka02.multicastbits.com:2181,kafka03.multicastbits.com:2181
zookeeper.sasl.client=true
zookeeper.sasl.clientconfig=ZookeeperClient


zookeeper connect options

Define the zookeeper servers the broker will connect to

zookeeper.connect=kafka01.multicastbits.com:2181,kafka02.multicastbits.com:2181,kafka03.multicastbits.com:2181

Enable SASL

zookeeper.sasl.client=true

Tell the broker to use the creds defined under ZookeeperClient section on the JaaS file used by the kafka service

zookeeper.sasl.clientconfig=ZookeeperClient

Broker and listener configuration

Define the broker id

broker.id=1

Define the servers listener name and port

listeners=SASL_SSL://kafka01.multicastbits.com:9093

Define the servers advertised listener name and port

advertised.listeners=SASL_SSL://kafka01.multicastbits.com:9093

Define the SASL_SSL for security protocol

listener.security.protocol.map=SASL_SSL:SASL_SSL

Enable ACLs

authorizer.class.name=kafka.security.authorizer.AclAuthorizer

Define the Java Keystores

ssl.keystore.location=/opt/kafka/secrets/kafkanode1.keystore.jks

ssl.keystore.password=keystorePassword

ssl.truststore.location=/opt/kafka/secrets/kafkanode1.truststore.jks

ssl.truststore.password=truststorePassword

Jaas configuration

/opt/kafka/kafka_2.13-3.8.0/config/kafka_server_jaas.conf

KafkaServer {
  org.apache.kafka.common.security.scram.ScramLoginModule required
  username="multicastbitskafkaadmin"
  password="kafkaadmin-password";
};
ZookeeperClient {
  org.apache.zookeeper.server.auth.DigestLoginModule required
  username="multicastbitszk"
  password="Zookeeper_password";
};


SASL and SCRAM configuration Notes

Enable SASL SCRAM for authentication

org.apache.kafka.common.security.scram.ScramLoginModule required

Use MD5 for Zookeeper authentication

org.apache.zookeeper.server.auth.DigestLoginModule required

KafkaOPTS

KafkaOPTS Java variable need to be passed and must point to the correct JaaS file, when the kafka service is started

export KAFKA_OPTS="-Djava.security.auth.login.config=/opt/kafka/kafka_2.13-3.8.0/config/kafka_server_jaas.conf"


Systemd service

Create the launch shell script for kafka

/opt/kafka/kafka_2.13-3.8.0/bin/multicastbitskafka-server-start.sh

#!/bin/bash
#export the env variable
export KAFKA_OPTS="-Djava.security.auth.login.config=/opt/kafka/kafka_2.13-3.8.0/config/kafka_server_jaas.conf"
#Start the kafka service
/opt/kafka/kafka_2.13-3.8.0/bin/kafka-server-start.sh /opt/kafka/kafka_2.13-3.8.0/config/server.properties
#debug - launch config with no SSL - we need this for initial setup and debug
#/opt/kafka/kafka_2.13-3.8.0/bin/kafka-server-start.sh /opt/kafka/kafka_2.13-3.8.0/config/server-NOSSL_AUTH.properties


Create the systemd service

/etc/systemd/system/kafka.service

[Unit]
Description=Apache Kafka Broker Service
After=network.target zookeeper.service
[Service]
User=multicastbitskafka
Group=multicastbitskafka
ExecStart=/opt/kafka/kafka_2.13-3.8.0/bin/multicastbitskafka-server-start.sh
Restart=on-failure
[Install]
WantedBy=multi-user.target


Connect authenticate and use Kafka CLI tools

Requirements

  • multicastbitsadmin.keystore.jks
  • multicastbitsadmin.truststore.jks
  • WSL2 with java-11-openjdk-devel wget nano
  • Kafka 3.8 folder extracted locally

Setup your environment

  • Setup WSL2

You can use any Linux environment with JDK17 or 11

  • install dependencies

dnf install -y wget nano java-11-openjdk-devel

Download Kafka and extract it (in going to extract it to the home DIR under kafka)

# 1. Download Kafka (Choose a version compatible with your server)
wget https://dlcdn.apache.org/kafka/3.8.0/kafka_2.13-3.8.0.tgz
# 2. Extract
tar xzf kafka_2.13-3.8.0.tgz


Copy the jks files (You should generate them with the CA JKS, or use one from one of the nodes) to ~/

cp multicastbitsadmin.keystore.jks ~/


cp multicastbitsadmin.truststore.jks ~/

Create your admin client properties file

change the path to fit your setup

nano ~/kafka-adminclient.properties

# Security protocol and SASL/SSL configuration
security.protocol=SASL_SSL
sasl.mechanism=SCRAM-SHA-512
# SSL Configuration
ssl.keystore.location=/opt/kafka/secrets/multicastbitsadmin.keystore.jks
ssl.keystore.password=keystorepw
ssl.truststore.location=/opt/kafka/secrets/multicastbitsadmin.truststore.jks
ssl.truststore.password=truststorepw
# SASL Configuration
sasl.jaas.config=org.apache.kafka.common.security.scram.ScramLoginModule required 
    username="#youradminUser#" 
		password="#your-admin-PW#";


Create the JaaS file for the admin client

nano ~/kafka_client_jaas.conf

Some kafka-cli tools still look for the jaas.conf under KAFKA_OPTS environment variable

KafkaClient {
  org.apache.kafka.common.security.scram.ScramLoginModule required
  username="#youradminUser#"
  password="#your-admin-PW#";
};


Export the Kafka environment variables

export KAFKA_HOME=/opt/kafka/kafka_2.13-3.8.0
export PATH=$PATH:$KAFKA_HOME/bin
export JAVA_HOME=$(dirname $(dirname $(readlink -f $(which java))))
export KAFKA_OPTS="-Djava.security.auth.login.config=~/kafka_client_jaas.conf"
source ~/.bashrc


Kafka CLI Usage Examples

Create a user

kafka-configs.sh --bootstrap-server kafka01.multicastbits.com:9093 --alter --add-config 'SCRAM-SHA-512=[password=#password#]' --entity-type users --entity-name %username%--command-config ~/kafka-adminclient.properties


Create a topic

kafka-topics.sh --bootstrap-server kafka01.multicastbits.com:9093 --create --topic %topicname% --partitions 10 --replication-factor 3 --command-config ~/kafka-adminclient.properties


Create ACLs

External customer user with READ DESCRIBE privileges to a single topic

kafka-acls.sh --bootstrap-server kafka01.multicastbits.com:9093 
  --command-config ~/kafka-adminclient.properties 
  --add --allow-principal User:customer-user01 
  --operation READ --operation DESCRIBE --topic Customer_topic


Troubleshooting

Here are some common issues you might encounter when setting up and using Kafka with SASL_SCRAM authentication, along with their solutions:

1. Connection refused errors

Issue: Clients unable to connect to Kafka brokers.

Solution:

  • Verify that the Kafka brokers are running and listening on the correct ports.
  • Check firewall settings to ensure the Kafka ports are open and accessible.
  • Confirm that the bootstrap server addresses in client configurations are correct.

2. Authentication failures

Issue: Clients fail to authenticate with Kafka brokers.

Solution:

  • Double-check username and password in the JAAS configuration file.
  • Ensure the SCRAM credentials are properly set up on the Kafka brokers.
  • Verify that the correct SASL mechanism (SCRAM-SHA-512) is specified in client configurations.

3. SSL/TLS certificate issues

Issue: SSL handshake failures or certificate validation errors.

Solution:

  • Confirm that the keystore and truststore files are correctly referenced in configurations.
  • Verify that the certificates in the truststore are up-to-date and not expired.
  • Ensure that the hostname in the certificate matches the broker’s advertised listener.

4. Zookeeper connection issues

Issue: Kafka brokers unable to connect to Zookeeper ensemble.

Solution:

  • Verify Zookeeper connection string in Kafka broker configurations.
  • Ensure Zookeeper servers are running and accessible and the ports are open
  • Check Zookeeper client authentication settings in JAAS configuration file


NFS Provisioner Setup and Testing Guide for Rancher RKE2/Kubernetes

This guide covers how to add an NFS StorageClass and a dynamic provisioner to Kubernetes using the nfs-subdir-external-provisioner Helm chart. This enables us to mount NFS shares dynamically for PersistentVolumeClaims (PVCs) used by workloads.

Example use cases:

  • Database migrations
  • Apache Kafka clusters
  • Data processing pipelines

Requirements:

  • An accessible NFS share exported with: rw,sync,no_subtree_check,no_root_squash
  • NFSv3 or NFSv4 protocol
  • Kubernetes v1.31.7+ or RKE2 with rke2r1 or later


lets get to it


1. NFS Server Export Setup

Ensure your NFS server exports the shared directory correctly:

# /etc/exports
/rke-pv-storage  worker-node-ips(rw,sync,no_subtree_check,no_root_squash)


  • Replace worker-node-ips with actual IPs or CIDR blocks of your worker nodes.
  • Run sudo exportfs -r to reload the export table.

2. Install NFS Subdir External Provisioner

Add the Helm repo and install the provisioned:

helm repo add nfs-subdir-external-provisioner \
  https://kubernetes-sigs.github.io/nfs-subdir-external-provisioner/
helm repo update

helm install nfs-client-provisioner \
  nfs-subdir-external-provisioner/nfs-subdir-external-provisioner \
  --namespace kube-system \
  --set nfs.server=192.168.162.100 \
  --set nfs.path=/rke-pv-storage \
  --set storageClass.name=nfs-client \
  --set storageClass.defaultClass=false

Notes:

  • If you want this to be the default storage class, change storageClass.defaultClass=true.
  • nfs.server should point to the IP of your NFS server.
  • nfs.path must be a valid exported directory from that NFS server.
  • storageClass.name can be referenced in your PersistentVolumeClaim YAMLs using storageClassName: nfs-client.

3. PVC and Pod Test

Create a test PVC and pod using the following YAML:

# test-nfs-pvc.yaml
apiVersion: v1
kind: PersistentVolumeClaim
metadata:
  name: test-nfs-pvc
spec:
  accessModes:
    - ReadWriteMany
  storageClassName: nfs-client
  resources:
    requests:
      storage: 1Gi
---
apiVersion: v1
kind: Pod
metadata:
  name: test-nfs-pod
spec:
  containers:
  - name: shell
    image: busybox
    command: [ "sh", "-c", "sleep 3600" ]
    volumeMounts:
    - name: data
      mountPath: /data
  volumes:
  - name: data
    persistentVolumeClaim:
      claimName: test-nfs-pvc


Apply it:

kubectl apply -f test-nfs-pvc.yaml
kubectl get pvc test-nfs-pvc -w


Expected output:

NAME           STATUS   VOLUME                                     CAPACITY   ACCESS MODES   STORAGECLASS   AGE
test-nfs-pvc   Bound    pvc-xxxxxxxx-xxxx-xxxx-xxxx-xxxxxxxxxxxx   1Gi        RWX            nfs-client     30s


4. Troubleshooting

If the PVC remains in Pending, follow these steps:

Check the provisioner pod status:

kubectl get pods -n kube-system | grep nfs-client-provisioner


Inspect the provisioner pod:

kubectl describe pod -n kube-system <pod-name>
kubectl logs -n kube-system <pod-name>


Common Issues:

  • Broken State: Bad NFS mount
    mount.nfs: access denied by server while mounting 192.168.162.100:/pl-elt-kakfka


    • This usually means the NFS path is misspelled or not exported properly.
  • Broken State: root_squash enabled
    failed to provision volume with StorageClass "nfs-client": unable to create directory to provision new pv: mkdir /persistentvolumes/โ€ฆ: permission denied


    • Fix by changing the export to use no_root_squash or chown the directory to nobody:nogroup.
  • ImagePullBackOff
    • Ensure nodes have internet access and can reach registry.k8s.io.
  • RBAC errors
    • Make sure the ServiceAccount used by the provisioner has permissions to watch PVCs and create PVs.

5. Healthy State Example

kubectl get pods -n kube-system | grep nfs-client-provisioner-nfs-subdir-external-provisioner
nfs-client-provisioner-nfs-subdir-external-provisioner-7992kq7m   1/1     Running     0          3m39s


kubectl describe pod -n kube-system nfs-client-provisioner-nfs-subdir-external-provisioner-7992kq7m
# Output shows pod is Running with Ready=True


kubectl logs -n kube-system nfs-client-provisioner-nfs-subdir-external-provisioner-7992kq7m
...
I0512 21:46:03.752701       1 controller.go:1420] provision "default/test-nfs-pvc" class "nfs-client": volume "pvc-73481f45-3055-4b4b-80f4-e68ffe83802d" provisioned
I0512 21:46:03.752763       1 volume_store.go:212] Trying to save persistentvolume "pvc-73481f45-3055-4b4b-80f4-e68ffe83802d"
I0512 21:46:03.772301       1 volume_store.go:219] persistentvolume "pvc-73481f45-3055-4b4b-80f4-e68ffe83802d" saved
I0512 21:46:03.772353       1 event.go:278] Event(v1.ObjectReference{Kind:"PersistentVolumeClaim", Name:"test-nfs-pvc"}): type: 'Normal' reason: 'ProvisioningSucceeded' Successfully provisioned volume pvc-73481f45-3055-4b4b-80f4-e68ffe83802d
...


Once test-nfs-pvc is bound and the pod starts successfully, your setup is working. You can now safely use storageClass: nfs-client in other workloads (e.g., Strimzi KafkaNodePool).


Find the PCI-E Slot number of PCI-E Add On card GPU, NIC, etc on Linux/Proxmox

i was working on a v-GPU POC using PVE Since Broadcom Screwed us with the Vsphere licensing costs (New post incoming about this adventure)

anyway i needed to find the PCI-E Slot used for the A4000 GPU on the host to disable it for troubleshooting

Guide

First we need to find the occupied slots and the Bus address for each slot

sudo dmidecode -t slot | grep -E "Designation|Usage|Bus Address"

Output will show the Slot ID, Usage and then the Bus Address

        Designation: CPU SLOT1 PCI-E 4.0 X16
        Current Usage: Available
        Bus Address: 0000:ff:00.0
        Designation: CPU SLOT2 PCI-E 4.0 X8
        Current Usage: In Use
        Bus Address: 0000:41:00.0
        Designation: CPU SLOT3 PCI-E 4.0 X16
        Current Usage: In Use
        Bus Address: 0000:c1:00.0
        Designation: CPU SLOT4 PCI-E 4.0 X8
        Current Usage: Available
        Bus Address: 0000:ff:00.0
        Designation: CPU SLOT5 PCI-E 4.0 X16
        Current Usage: In Use
        Bus Address: 0000:c2:00.0
        Designation: CPU SLOT6 PCI-E 4.0 X16
        Current Usage: Available
        Bus Address: 0000:ff:00.0
        Designation: CPU SLOT7 PCI-E 4.0 X16
        Current Usage: In Use
        Bus Address: 0000:81:00.0
        Designation: PCI-E M.2-M1
        Current Usage: Available
        Bus Address: 0000:ff:00.0
        Designation: PCI-E M.2-M2
        Current Usage: Available
        Bus Address: 0000:ff:00.0

We can use lspci -s #BusAddress# to locate whats installed on each slot

lspci -s 0000:c2:00.0
c2:00.0 3D controller: NVIDIA Corporation GA102GL [RTX A5000] (rev a1)

lspci -s 0000:81:00.0
81:00.0 VGA compatible controller: NVIDIA Corporation GA104GL [RTX A4000] (rev a1)

Im sure there is a much more elegant way to do this, but this worked as a quick ish way to find what i needed. if you know a better way please share in the comments

Until next time!!!

Reference –

https://stackoverflow.com/questions/25908782/in-linux-is-there-a-way-to-find-out-which-pci-card-is-plugged-into-which-pci-sl

Use Mailx to send emails using office 365

just something that came up while setting up a monitoring script using mailx, figured ill note it down here so i can get it to easily later when I need it ๐Ÿ˜€

Important prerequisites

  • You need to enable smtp basic Auth on Office 365 for the account used for authentication
  • Create an App password for the user account
  • nssdb folder must be available and readable by the user running the mailx command

Assuming all of the above prerequisite are $true we can proceed with the setup

Install mailx

RHEL/Alma linux

sudo dnf install mailx

NSSDB Folder

make sure the nssdb folder must be available and readable by the user running the mailx command

certutil -L -d /etc/pki/nssdb

The Output might be empty, but that’s ok; this is there if you need to add a locally signed cert or another CA cert manually, Microsoft Certs are trusted by default if you are on an up to date operating system with the local System-wide Trust Store

Reference – RHEL-sec-shared-system-certificates

Configure Mailx config file

sudo nano /etc/mail.rc

Append/prepend the following lines and Comment out or remove the same lines already defined on the existing config files

set smtp=smtp.office365.com
set smtp-auth-user=###[email protected]###
set smtp-auth-password=##Office365-App-password#
set nss-config-dir=/etc/pki/nssdb/
set ssl-verify=ignore
set smtp-use-starttls
set from="###[email protected]###"

This is the bare minimum needed other switches are located here – link

Testing

echo "Your message is sent!" | mailx -v -s "test" [email protected]

-v switch will print the verbos debug log to console

Connecting to 52.96.40.242:smtp . . . connected.
220 xxde10CA0031.outlook.office365.com Microsoft ESMTP MAIL Service ready at Sun, 6 Aug 2023 22:14:56 +0000
>>> EHLO vls-xxx.multicastbits.local
250-MN2PR10CA0031.outlook.office365.com Hello [167.206.57.122]
250-SIZE 157286400
250-PIPELINING
250-DSN
250-ENHANCEDSTATUSCODES
250-STARTTLS
250-8BITMIME
250-BINARYMIME
250-CHUNKING
250 SMTPUTF8
>>> STARTTLS
220 2.0.0 SMTP server ready
>>> EHLO vls-xxx.multicastbits.local
250-xxde10CA0031.outlook.office365.com Hello [167.206.57.122]
250-SIZE 157286400
250-PIPELINING
250-DSN
250-ENHANCEDSTATUSCODES
250-AUTH LOGIN XOAUTH2
250-8BITMIME
250-BINARYMIME
250-CHUNKING
250 SMTPUTF8
>>> AUTH LOGIN
334 VXNlcm5hbWU6
>>> Zxxxxxxxxxxxc0BmdC1zeXMuY29t
334 UGsxxxxxmQ6
>>> c2Rxxxxxxxxxxducw==
235 2.7.0 Authentication successful
>>> MAIL FROM:<###[email protected]###>
250 2.1.0 Sender OK
>>> RCPT TO:<[email protected]>
250 2.1.5 Recipient OK
>>> DATA
354 Start mail input; end with <CRLF>.<CRLF>
>>> .
250 2.0.0 OK <[email protected]> [Hostname=Bsxsss744.namprd11.prod.outlook.com]
>>> QUIT
221 2.0.0 Service closing transmission channel 

Now you can use this in your automation scripts or timers using the mailx command

#!/bin/bash

log_file="/etc/app/runtime.log"
recipient="[email protected]"
subject="Log file from /etc/app/runtime.log"

# Check if the log file exists
if [ ! -f "$log_file" ]; then
  echo "Error: Log file not found: $log_file"
  exit 1
fi

# Use mailx to send the log file as an attachment
echo "Sending log file..."
mailx -s "$subject" -a "$log_file" -r "[email protected]" "$recipient" < /dev/null
echo "Log file sent successfully."

Secure it

sudo chown root:root /etc/mail.rc
sudo chmod 600 /etc/mail.rc

The above commands change the file’s owner and group to root, then set the file permissions to 600, which means only the owner (root) has read and write permissions and other users have no access to the file.

Use Environment Variables: Avoid storing sensitive information like passwords directly in the mail.rc file, consider using environment variables for sensitive data and reference those variables in the configuration.

For example, in the mail.rc file, you can set:

set smtp-auth-password=$MY_EMAIL_PASSWORD

You can set the variable using another config file or store it in the Ansible vault during runtime or use something like Hashicorp.

Sure, I would just use Python or PowerShell core, but you will run into more locked-down environments like OCI-managed DB servers with only Mailx is preinstalled and the only tool you can use ๐Ÿ™

the Fact that you are here means you are already in the same boat. Hope this helped… until next time

Solution – RKE Cluster MetalLB provides Services with IP Addresses but doesn’t ARP for the address

I ran in to the the same issue detailed here working with a RKE cluster

https://github.com/metallb/metallb/issues/1154

After looking around for a few hours digging in to the logs i figured out the issue, hopefully this helps some one else our there in the situation save some time.

Make sure the IPVS mode is enabled on the cluster configuration

If you are using :

RKE2 – edit the cluster.yaml file

RKE1 – Edit the cluster configuration from the rancher UI > Cluster management > Select the cluster > edit configuration > edit as YAML

Locate the services field under rancher_kubernetes_engine_config and add the following options to enable IPVS

    kubeproxy:
      extra_args:
        ipvs-scheduler: lc
        proxy-mode: ipvs

https://www.suse.com/support/kb/doc/?id=000020035

Default

After changes

Make sure the Kernel modules are enabled on the nodes running control planes

Background

Example Rancher – RKE1 cluster

sudo docker ps | grep proxy # find the container ID for kubproxy

sudo docker logs ####containerID###

0313 21:44:08.315888  108645 feature_gate.go:245] feature gates: &{map[]}
I0313 21:44:08.346872  108645 proxier.go:652] "Failed to load kernel module with modprobe, you can ignore this message when kube-proxy is running inside container without mounting /lib/modules" moduleName="nf_conntrack_ipv4"
E0313 21:44:08.347024  108645 server_others.go:107] "Can't use the IPVS proxier" err="IPVS proxier will not be used because the following required kernel modules are not loaded: [ip_vs_lc]"

Kubproxy is trying to load the needed kernel modules and failing to enable IPVS

Lets enable the kernel modules

sudo nano /etc/modules-load.d/ipvs.conf

ip_vs_lc
ip_vs
ip_vs_rr
ip_vs_wrr
ip_vs_sh
nf_conntrack_ipv4

Install ipvsadm to confirm the changes

sudo dnf install ipvsadm -y

Reboot the VM or the Baremetal server

use the sudo ipvsadm to confirm ipvs is enabled

sudo ipvsadm

Testing

kubectl get svc -n #namespace | grep load
arping -I ens192 192.168.94.140
ARPING 192.168.94.140 from 192.168.94.65 ens192
Unicast reply from 192.168.94.140 [00:50:56:96:E3:1D] 1.117ms
Unicast reply from 192.168.94.140 [00:50:56:96:E3:1D] 0.737ms
Unicast reply from 192.168.94.140 [00:50:56:96:E3:1D] 0.845ms
Unicast reply from 192.168.94.140 [00:50:56:96:E3:1D] 0.668ms
Sent 4 probes (1 broadcast(s))
Received 4 response(s)

If you have the service type load balancer on a deployment now you should be able to reach it if the container is responding on the service

helpful Links

https://metallb.universe.tf/configuration/troubleshooting/

https://github.com/metallb/metallb/issues/1154

https://github.com/rancher/rke2/issues/3710

How to extend root (cs-root) Filesystem using LVM Cent OS/RHEL/Almalinux

This guide will walk you through on how to extend and increase space for the root filesystem on a alma linux. Cent OS, REHL Server/Desktop/VM

Method A – Expanding the current disk

Edit the VM and Add space to the Disk

install the cloud-utils-growpart package, as the growpart command in it makes it really easy to extend partitioned virtual disks.

sudo dnf install cloud-utils-growpart

Verify that the VM’s operating system recognizes the new increased size of the sda virtual disk, using lsblk or fdisk -l

sudo fdisk -l
Notes -
Note down the disk id and the partition number for Linux LVM - in this demo disk id is sda and lvm partition is sda 3

lets trigger a rescan of a block devices (Disks)

#elevate to root
sudo su 

#trigger a rescan, Make sure to match the disk ID you noted down before 
echo 1 > /sys/block/sda/device/rescan
exit

Now sudo fdisk -l shows the correct size of the disks

Use growpart to increase the partition size for the lvm

sudo growpart /dev/sda 3

Confirm the volume group name

sudo vgs

Extend the logical volume

sudo lvextend -l +100%FREE /dev/almalinux/root

Grow the file system size

sudo xfs_growfs /dev/almalinux/root
Notes -
You can use this same steps to add space to different partitions such as home, swap if needed

Method B -Adding a second Disk to the LVM and expanding space

Why add a second disk?
may be the the current Disk is locked due to a snapshot and you cant remove it, Only solution would be to add a second disk/

Check the current space available

sudo df -h 
Notes -
If you have 0% ~1MB left on the cs-root command auto-complete with tab and some of the later commands wont work, You should clear up atleast 4-10mb by clearing log files, temp files, etc

Mount an additional disk to the VM (Assuming this is a VM) and make sure the disk is visible on the OS level

sudo lvmdiskscan

OR

sudo fdisk -l

Confirm the volume group name

sudo vgs

Lets increase the space

First lets initialize the new disk we mounted

sudo mkfs.xfs /dev/sdb

Create the Physical volume

sudo pvcreate /dev/sdb

extend the volume group

sudo vgextend cs /dev/sdb
  Volume group "cs" successfully extended


Extend the logical volume

sudo lvextend -l +100%FREE /dev/cs/root

Grow the file system size

sudo xfs_growfs /dev/cs/root

Confirm the changes

sudo df -h

Just making easy for us!!

#Method A - Expanding the current disk 
#AlmaLinux
sudo dnf install cloud-utils-growpart

sudo lvmdiskscan
sudo fdisk -l                          #note down the disk ID and partition num


sudo su                                #elevate to root
echo 1 > /sys/block/sda/device/rescan  #trigger a rescan
exit                                   #exit root shell

sudo lvextend -l +100%FREE /dev/almalinux/root
sudo xfs_growfs /dev/almalinux/root
sudo df -h

#Method B - Adding a second Disk 
#CentOS

sudo lvmdiskscan
sudo fdisk -l
sudo vgs
sudo mkfs.xfs /dev/sdb
sudo pvcreate /dev/sdb
sudo vgextend cs /dev/sdb
sudo lvextend -l +100%FREE /dev/cs/root
sudo xfs_growfs /dev/cs/root
sudo df -h

#AlmaLinux

sudo lvmdiskscan
sudo fdisk -l
sudo vgs
sudo mkfs.xfs /dev/sdb
sudo pvcreate /dev/sdb
sudo vgextend almalinux /dev/sdb
sudo lvextend -l +100%FREE /dev/almalinux/root
sudo xfs_growfs /dev/almalinux/root
sudo df -h

Setup guide for VSFTPD FTP Server – SELinux enforced with fail2ban (RHEL, CentOS, Almalinux)

Few things to note

  • if you want to prevent directory traversal we need to setup chroot with vsftpd (not covered on this KB)
  • For the demo I just used Unencrypted FTP on port 21 to keep things simple, Please utilize SFTP with the letsencrypt certificate for better security. i will cover this on another article and link it here

Update and Install packages we need

sudo dnf update
sudo dnf install net-tools lsof unzip zip tree policycoreutils-python-utils-2.9-20.el8.noarch vsftpd nano setroubleshoot-server -y

Setup Groups and Users and security hardening

if you want to prevent directory traversal we need to setup chroot with vsftpd (not covered on this KB)

Create the Service admin account

sudo useradd ftpadmin
sudo passwd ftpadmin

Create the group

sudo groupadd FTP_Root_RW

Create FTP only user shell for the FTP users

echo -e '#!/bin/sh\necho "This account is limited to FTP access only."' | sudo tee -a /bin/ftponly
sudo chmod a+x /bin/ftponly

echo "/bin/ftponly" | sudo tee -a /etc/shells

Create FTP users

sudo useradd ftpuser01 -m -s /bin/ftponly
sudo useradd ftpuser02 -m -s /bin/ftponly
user passwd ftpuser01 
user passwd ftpuser02

Add the users to the group

sudo usermod -a -G FTP_Root_RW ftpuser01
sudo usermod -a -G FTP_Root_RW ftpuser02

sudo usermod -a -G FTP_Root_RW ftpadmin

Disable SSH Access for the FTP users.

Edit sshd_config

sudo nano /etc/ssh/sshd_config

Add the following line to the end of the file

DenyUsers ftpuser01 ftpuser02

Open ports on the VM Firewall

sudo firewall-cmd --permanent --add-port=20-21/tcp

#Allow the passive Port-Range we will define it later on the vsftpd.conf
sudo firewall-cmd --permanent --add-port=60000-65535/tcp

#Reload the ruleset
sudo firewall-cmd --reload

Setup the Second Disk for FTP DATA

Attach another disk to the VM and reboot if you haven’t done this already

lsblk to check the current disks and partitions detected by the system

lsblk 

Create the XFS partition

sudo mkfs.xfs /dev/sdb
# use mkfs.ext4 for ext4

Why XFS? https://access.redhat.com/articles/3129891

Create the folder for the mount point

sudo mkdir /FTP_DATA_DISK

Update the etc/fstab file and add the following line

sudo nano etc/fstab
/dev/sdb /FTP_DATA_DISK xfs defaults 1 2

Mount the disk

sudo mount -a

Testing

mount | grep sdb

Setup the VSFTPD Data and Log Folders

Setup the FTP Data folder

sudo mkdir /FTP_DATA_DISK/FTP_Root -p

Create the log directory

sudo mkdir /FTP_DATA_DISK/_logs/ -p

Set permissions

sudo chgrp -R FTP_Root_RW /FTP_DATA_DISK/FTP_Root/
sudo chmod 775 -R /FTP_DATA_DISK/FTP_Root/

Setup the VSFTPD Config File

Backup the default vsftpd.conf and create a newone

sudo mv /etc/vsftpd/vsftpd.conf /etc/vsftpd/vsftpdconfback
sudo nano /etc/vsftpd/vsftpd.conf
#KB Link - ####

anonymous_enable=NO
local_enable=YES
write_enable=YES
local_umask=002
dirmessage_enable=YES
ftpd_banner=Welcome to multicastbits Secure FTP service.
chroot_local_user=NO
chroot_list_enable=NO
chroot_list_file=/etc/vsftpd/chroot_list
listen=YES
listen_ipv6=NO

userlist_file=/etc/vsftpd/user_list
pam_service_name=vsftpd
userlist_enable=YES
userlist_deny=NO
listen_port=21
connect_from_port_20=YES
local_root=/FTP_DATA_DISK/FTP_Root/

xferlog_enable=YES
vsftpd_log_file=/FTP_DATA_DISK/_logs/vsftpd.log
log_ftp_protocol=YES
dirlist_enable=YES
download_enable=NO

pasv_enable=Yes
pasv_max_port=65535
pasv_min_port=60000

Add the FTP users to the userlist file

Backup the Original file

sudo mv /etc/vsftpd/user_list /etc/vsftpd/user_listBackup
echo "ftpuser01" | sudo tee -a /etc/vsftpd/user_list
echo "ftpuser02" | sudo tee -a /etc/vsftpd/user_list
sudo systemctl start vsftpd

sudo systemctl enable vsftpd

sudo systemctl status vsftpd

Setup SELinux

instead of putting our hands up and disabling SElinux, we are going to setup the policies correctly

Find the available policies using getsebool -a | grep ftp

getsebool -a | grep ftp

ftpd_anon_write --> off
ftpd_connect_all_unreserved --> off
ftpd_connect_db --> off
ftpd_full_access --> off
ftpd_use_cifs --> off
ftpd_use_fusefs --> off
ftpd_use_nfs --> off
ftpd_use_passive_mode --> off
httpd_can_connect_ftp --> off
httpd_enable_ftp_server --> off
tftp_anon_write --> off
tftp_home_dir --> off
[lxadmin@vls-BackendSFTP02 _logs]$ 
[lxadmin@vls-BackendSFTP02 _logs]$ 
[lxadmin@vls-BackendSFTP02 _logs]$ getsebool -a | grep ftp
ftpd_anon_write --> off
ftpd_connect_all_unreserved --> off
ftpd_connect_db --> off
ftpd_full_access --> off
ftpd_use_cifs --> off
ftpd_use_fusefs --> off
ftpd_use_nfs --> off
ftpd_use_passive_mode --> off
httpd_can_connect_ftp --> off
httpd_enable_ftp_server --> off
tftp_anon_write --> off
tftp_home_dir --> off

Set SELinux boolean values

sudo setsebool -P ftpd_use_passive_mode on

sudo setsebool -P ftpd_use_cifs on

sudo setsebool -P ftpd_full_access 1

    "setsebool" is a tool for setting SELinux boolean values, which control various aspects of the SELinux policy.

    "-P" specifies that the boolean value should be set permanently, so that it persists across system reboots.

    "ftpd_use_passive_mode" is the name of the boolean value that should be set. This boolean value controls whether the vsftpd FTP server should use passive mode for data connections.

    "on" specifies that the boolean value should be set to "on", which means that vsftpd should use passive mode for data connections.

    Enable ftp_home_dir --> on if you are using chroot

Add a new file context rule to the system.

sudo semanage fcontext -a -t public_content_rw_t "/FTP_DATA_DISK/FTP_Root/(/.*)?"
    "fcontext" is short for "file context", which refers to the security context that is associated with a file or directory.

    "-a" specifies that a new file context rule should be added to the system.

    "-t" specifies the new file context type that should be assigned to files or directories that match the rule.

    "public_content_rw_t" is the name of the new file context type that should be assigned to files or directories that match the rule. In this case, "public_content_rw_t" is a predefined SELinux type that allows read and write access to files and directories in public directories, such as /var/www/html.

    "/FTP_DATA_DISK/FTP_Root/(/.)?" specifies the file path pattern that the rule should match. The pattern includes the "/FTP_DATA_DISK/FTP_Root/" directory and any subdirectories or files beneath it. The regular expression "/(.)?" matches any file or directory name that may follow the "/FTP_DATA_DISK/FTP_Root/" directory path.

In summary, this command sets the file context type for all files and directories under the "/FTP_DATA_DISK/FTP_Root/" directory and its subdirectories to "public_content_rw_t", which allows read and write access to these files and directories.

Reset the SELinux security context for all files and directories under the “/FTP_DATA_DISK/FTP_Root/”

sudo restorecon -Rvv /FTP_DATA_DISK/FTP_Root/
    "restorecon" is a tool that resets the SELinux security context for files and directories to their default values.

    "-R" specifies that the operation should be recursive, meaning that the security context should be reset for all files and directories under the specified directory.

    "-vv" specifies that the command should run in verbose mode, which provides more detailed output about the operation.

"/FTP_DATA_DISK/FTP_Root/" is the path of the directory whose security context should be reset.

Setup Fail2ban

Install fail2ban

sudo dnf install fail2ban

Create the jail.local file

This file is used to overwrite the config blocks in /etc/fail2ban/fail2ban.conf
sudo nano /etc/fail2ban/jail.local
vsftpd]
enabled = true
port = ftp,ftp-data,ftps,ftps-data
logpath = /FTP_DATA_DISK/_logs/vsftpd.log
maxretry = 5
bantime = 7200

Make sure to update the logpath directive to match the vsftpd log file we defined on the vsftpd.conf file

sudo systemctl start fail2ban

sudo systemctl enable fail2ban

sudo systemctl status fail2ban
journalctl -u fail2ban  will help you narrow down any issues with the service

Testing

sudo tail -f /var/log/fail2ban.log

Fail2ban injects and manages the following rich rules

Client will fail to connect using FTP until the ban is lifted

Remove the ban IP list

#get the list of banned IPs 
sudo fail2ban-client get vsftpd banned

#Remove a specific IP from the list 
sudo fail2ban-client set vsftpd unbanip <IP>

#Remove/Reset all the the banned IP lists
sudo fail2ban-client unban --all

This should get you up and running, For the demo I just used Unencrypted FTP on port 21 to keep things simple, Please utilize SFTP with the letsencrypt certificate for better security. i will cover this on another article and link it here

Change the location of the Docker overlay2 storage directory

If you found this page you already know why you are looking for this, your server /dev/mapper/cs-root is filled due to /var/lib/docker taking up most of the space

Yes, you can change the location of the Docker overlay2 storage directory by modifying the daemon.json file. Here’s how to do it:

Open or create the daemon.json file using a text editor:

sudo nano /etc/docker/daemon.json

{
    "data-root": "/path/to/new/location/docker"
}

Replace “/path/to/new/location/docker” with the path to the new location of the overlay2 directory.

If the file already contains other configuration settings, add the "data-root" setting to the file under the "storage-driver" setting:

{
    "storage-driver": "overlay2",
    "data-root": "/path/to/new/location/docker"
}

Save the file and Restart docker

sudo systemctl restart docker

Don’t forget to remove the old data

rm -rf /var/lib/docker/overlay2