I’ve been diving deep into systems architecture lately, specifically Kubernetes
Strip away the UIs, the YAML, and the ceremony, and Kubernetes boils down to:
A very stubborn event driven collection of control loops
aka the reconciliation (Control) loop, and everything I read is calling this the “gold standard” for distributed control planes.
Because it decomposes the control plane into many small, independent loops, each continuously correcting drift rather than trying to execute perfect one-shot workflows. these loops are triggered by events or state changes, but what they do is determined by the the spec. vs observed state (status)
Now we have both:
- spec: desired state
- status: observed state
Kubernetes lives in that gap.
When spec and status match, everything’s quiet. When they don’t, something wakes up to ensure current state matches the declared state.
The Architecture of Trust
In Kubernetes, they don’t coordinate via direct peer-to-peer orchestration; They coordinate by writing to and watching one shared “state.”
That state lives behind the API server, and the API server validates it and persists it into etcd.
Role of the API server
The API server is the front door to the cluster’s shared truth: it’s the only place that can accept, validate, and persist declared intent as Kubernetes API objects (metadata/spec/status).
When you install a CRD, you’re extending the API itself with a new type (a new endpoint) or a schema the API server can validate against
When we use kubectl apply (or any client) to submit YAML/JSON to the API server, the API server validates it (built-in rules, CRD OpenAPI v3 schema / CEL rules, and potentially admission webhooks) and rejects invalid objects before they’re stored.
If the request passes validation, the API server persists the object into etcd (the whole API object, not just “intent”), and controllers/operators then watch that stored state and do the reconciliation work to make reality match it.
Once stored, controllers/operators (loops) watch those objects and run reconciliation to push the real world toward what’s declared.
it turns out In practice, most controllers don’t act directly on raw watch events, they consume changes through informer caches and queue work onto a rate-limited workqueue. They also often watch related/owned resources (secondary watches), not just the primary object, to stay convergent.
spec is often user-authored as discussed above, but it isn’t exclusively human-written, the scheduler and some controllers also update parts of it (e.g., scheduling decisions/bindings and defaulting).
Role of etcd cluster
etcd is the control plane’s durable record of “the authoritative reference for what the cluster believes that should exist and what it currently reports.”
If an intent (an API object) isn’t in etcd, controllers can’t converge on it—because there’s nothing recorded to reconcile toward
This makes the system inherently self-healing because it trusts the declared state and keeps trying to morph the world to match until those two align.
One tidbit worth noting:
In production, Nodes, runtimes, cloud load balancers can drift independently. Controllers treat those systems as observed state, and they keep measuring reality against what the API says should exist.
How the Loop Actually Works
Kubernetes isn’t one loop. It’s a bunch of loops(controllers) that all behave the same way:
- read desired state (what the API says should exist)
- observe actual state (what’s really happening)
- calculate the diff
- push reality toward the spec
As an example, let’s look at a simple nginx workload deployment
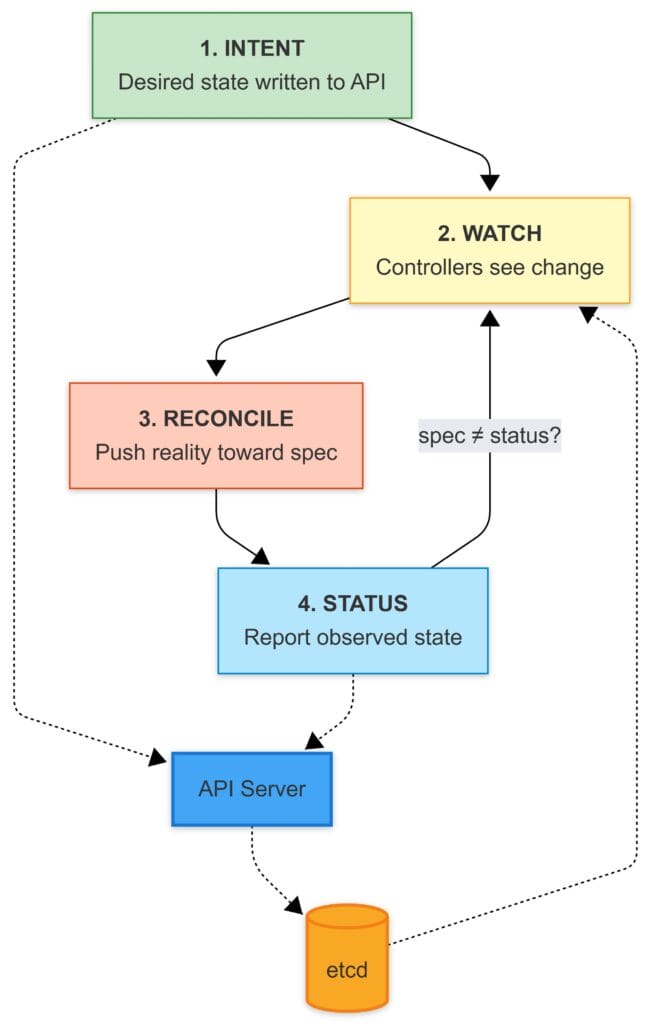
1) Intent (Desired State)
To Deploy the Nginx workload. You run:
kubectl apply -f nginx.yaml
The API server validates the object (and its schema, if it’s a CRD-backed type) and writes it into etcd.
At that point, Kubernetes has only recorded your intent. Nothing has “deployed” yet in the physical sense. The cluster has simply accepted:
“This is what the world should look like.”
2) Watch (The Trigger)
Controllers and schedulers aren’t polling the cluster like a bash script with a sleep 10.
They watch the API server.
When desired state changes, the loop responsible for it wakes up, runs through its logic, and acts:
“New desired state: someone wants an Nginx Pod.”
watches aren’t gospel. Events can arrive twice, late, or never, and your controller still has to converge. Controllers use list+watch patterns with periodic resync as a safety net. The point isn’t perfect signals it’s building a loop that stays correct under imperfect signals.
Controllers also don’t spin constantly they queue work. Events enqueue object keys; workers dequeue and reconcile; failures requeue with backoff. This keeps one bad object from melting the control plane.
3) Reconcile (Close the Gap)
Here’s the mental map that made sense to me:
Kubernetes is a set of level-triggered control loops. You declare desired state in the API, and independent loops keep working until the real world matches what you asked for.
- Controllers (Deployment/ReplicaSet/etc.) watch the API for desired state and write more desired state.
- Example: a Deployment creates/updates a ReplicaSet; a ReplicaSet creates/updates Pods.
- The scheduler finds Pods with no node assigned and picks a node.
- It considers resource requests, node capacity, taints/tolerations, node selectors, (anti)affinity, topology spread, and other constraints.
- It records its decision by setting
spec.nodeName on the Pod.
- The kubelet on the chosen node notices “a Pod is assigned to me” and makes it real.
- pulls images (if needed) via the container runtime (CRI)
- sets up volumes/mounts (often via CSI)
- triggers networking setup (CNI plugins do the actual wiring)
- starts/monitors containers and reports status back to the API
Each component writes its state back into the API, and the next loop uses that as input. No single component “runs the whole workflow.”
One property makes this survivable: reconcile must be safe to repeat (idempotent). The loop might run once or a hundred times (retries, resyncs, restarts, duplicate/missed watch events), and it should still converge to the same end result.
if the desired state is already satisfied, reconcile should do nothing; if something is missing, it should fill the gap, without creating duplicates or making things worse.
When concurrent updates happen (two controllers might try to update the same object at the same time)
Kubernetes handles this with optimistic concurrency. Every object has a resourceVersion (what version of this object did you read?”). If you try to write an update using an older version, the API server rejects it (often as a conflict).
Then the flow is: re-fetch the latest object, apply your change again, and retry.
4) Status (Report Back)
Once the pod is actually running, status flows back into the API.
The Loop Doesn’t Protect You From Yourself
What if the declared state says to delete something critical like kube-proxy or a CNI component? The loop doesn’t have opinions. It just does what the spec says.
A few things keep this from being a constant disaster:
- Control plane components are special. The API server, etcd, scheduler, controller-manager these usually run as static pods managed directly by kubelet, not through the API. The reconciliation loop can’t easily delete the thing running the reconciliation loop as long as its manifest exists on disk.
- DaemonSets recreate pods. Delete a kube-proxy pod and the DaemonSet controller sees “desired: 1, actual: 0” and spins up a new one. You’d have to delete the DaemonSet itself.
- RBAC limits who can do what. Most users can’t touch kube-system resources.
- Admission controllers can reject bad changes before they hit etcd.
But at the end, if your source of truth says “delete this,” the system will try. The model assumes your declared state is correct. Garbage in, garbage out.
This Pattern Outside Kubernetes
This pattern can be useful anywhere you manage state over time.
Scripts are fine until they aren’t:
- they assume the world didn’t change since last run
- they fail halfway and leave junk behind
- they encode “steps” instead of “truth”
A loop is simpler:
- define the desired state
- store it somewhere authoritative
- continuously reconcile reality back to it
Ref